
01 / Requirements and targets
Reliability planning
Measurable reliability requirements are derived from customer needs, legislation and product strategy. They define targets, responsibilities and a robust verification plan.
Explore topic
Reliability engineering connects requirements, risks, testing and field data to support robust development and release decisions.
Explore the five sub-processes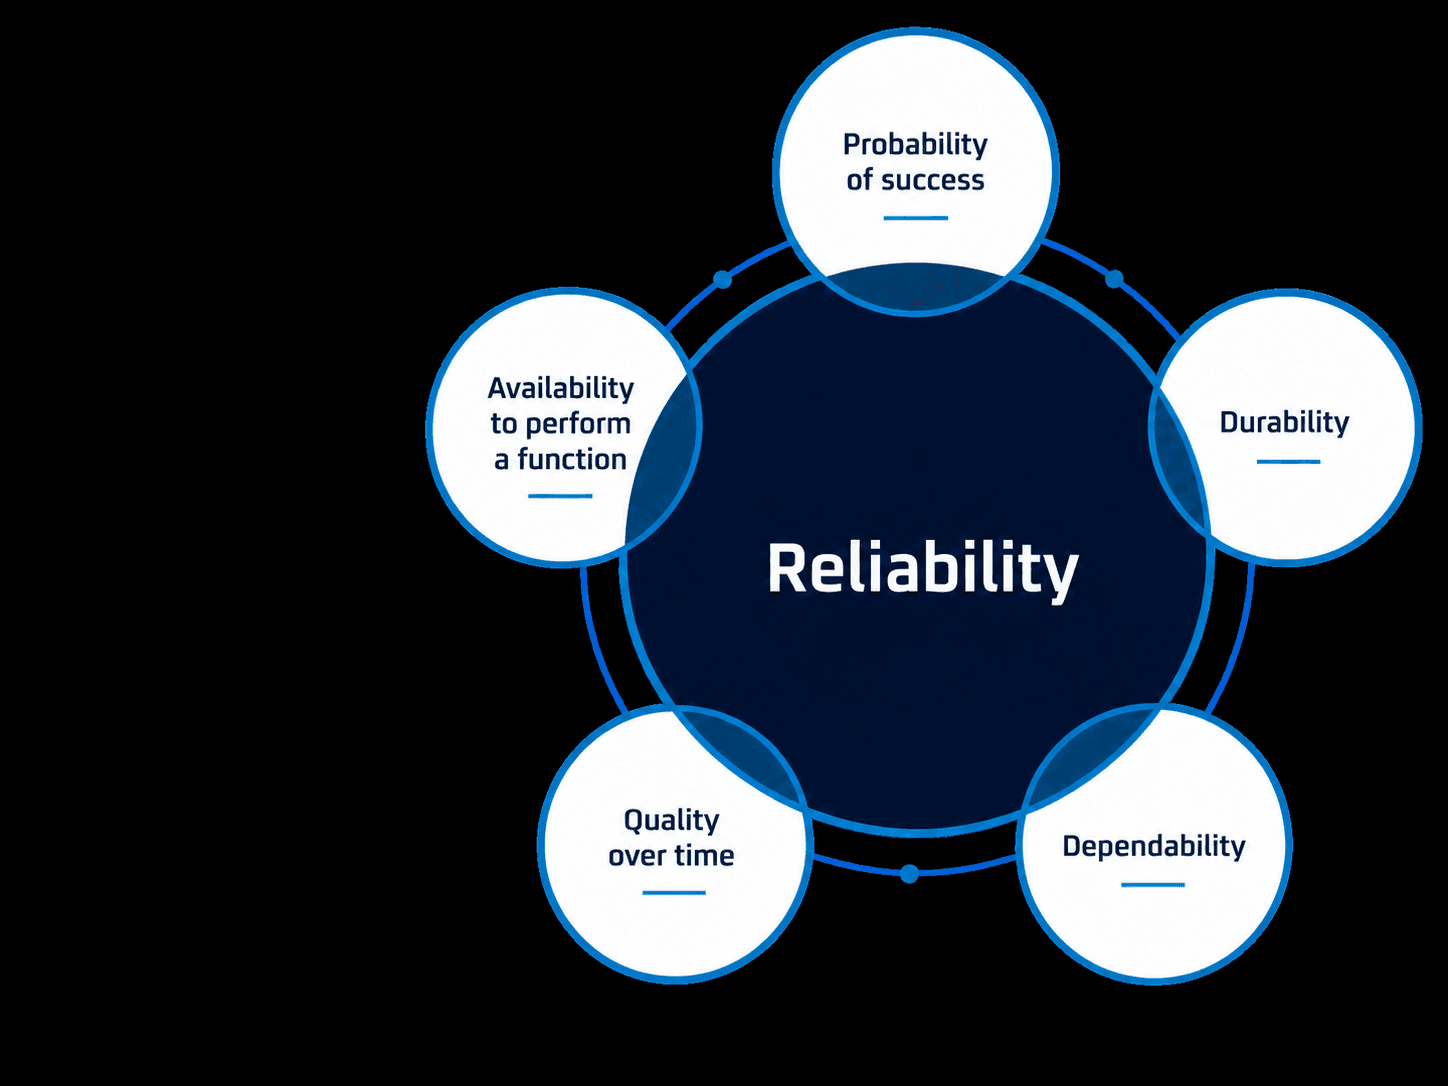
Reliability engineering examines the non-functionality of technical products and the causes of failure. It combines statistics and probability theory with mechanical engineering and modern product development.
The goal is not merely to describe failures. Technical problems need to be identified early, assessed systematically and controlled effectively throughout the product life cycle.
Foundation article
Understand what reliability means, how requirements, metrics and methods connect, and why the product life cycle provides the technical framework.
Explore the fundamentalsOverall process
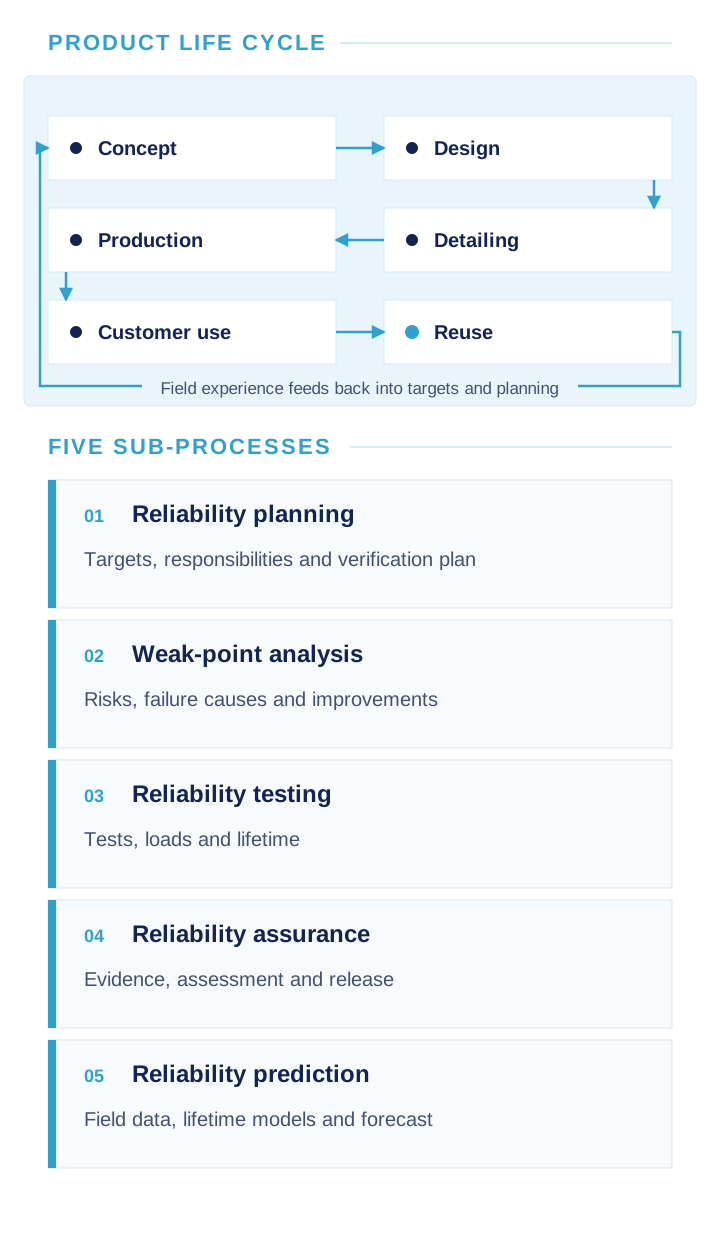
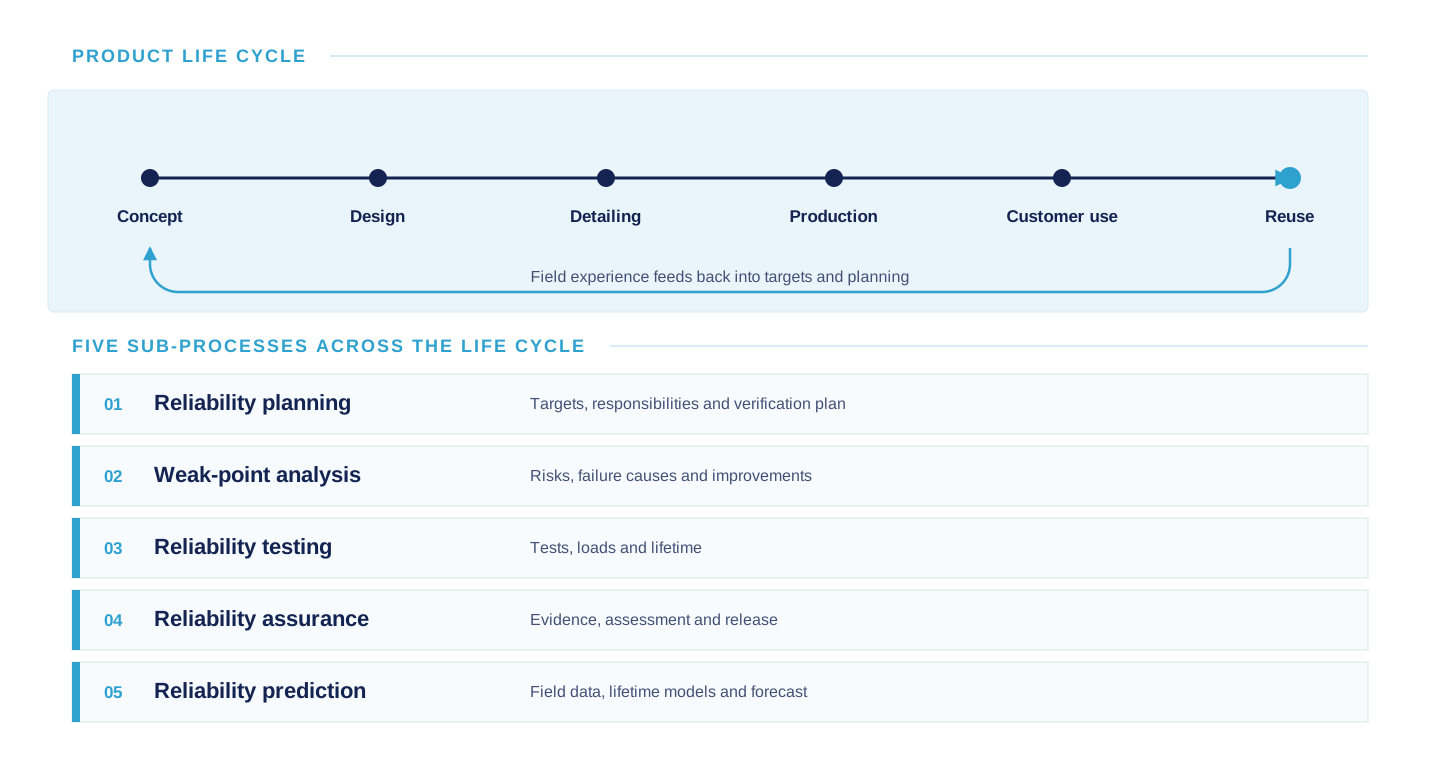
The life-cycle phases show the chronological sequence. The five sub-processes structure the technical work across all phases – from defining targets to predicting reliability from field data.
“Reliability is the probability that a product performs its required function without failure for a defined period under specified operating and environmental conditions.”
These five topics form the technical core of reliability engineering. Depending on the product and development stage, they can be addressed individually or connected in one integrated process.
01 / Requirements and targets
Measurable reliability requirements are derived from customer needs, legislation and product strategy. They define targets, responsibilities and a robust verification plan.
Explore topic02 / Risks and failure causes
Potential failure causes and critical functions are identified early. FMEA, FTA, reviews and field experience help prioritise risks and target improvements.
Explore topic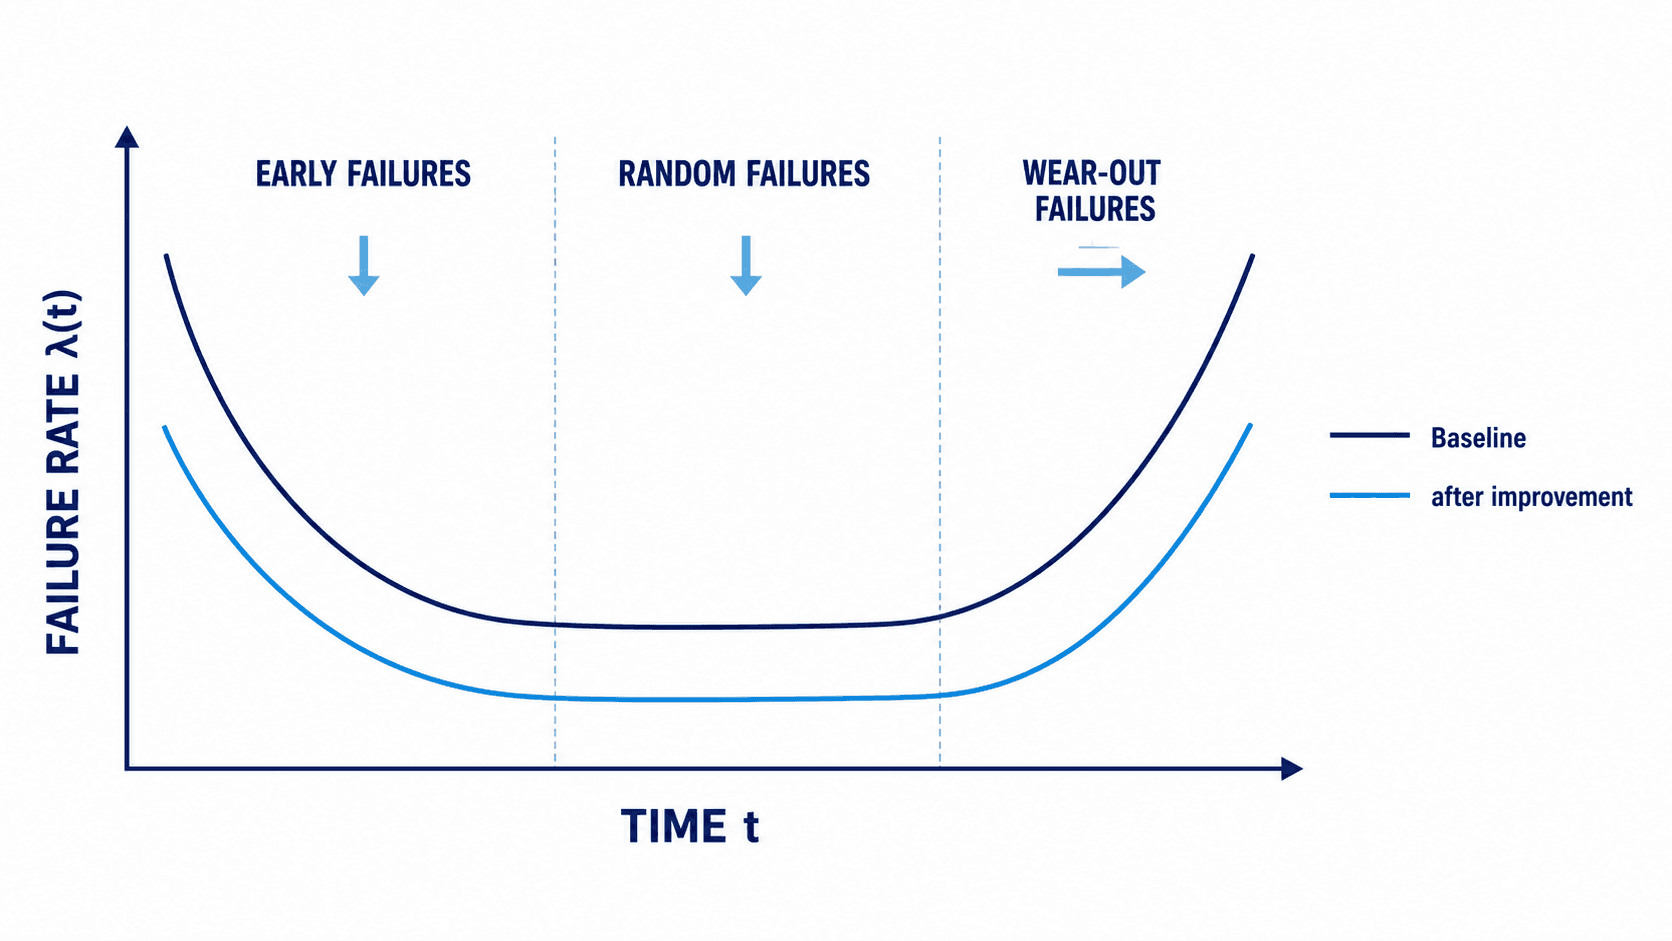
03 / Testing and lifetime
Tests assess function and lifetime under representative loads. Load profiles, samples and test durations are selected to generate robust evidence efficiently.
Explore topic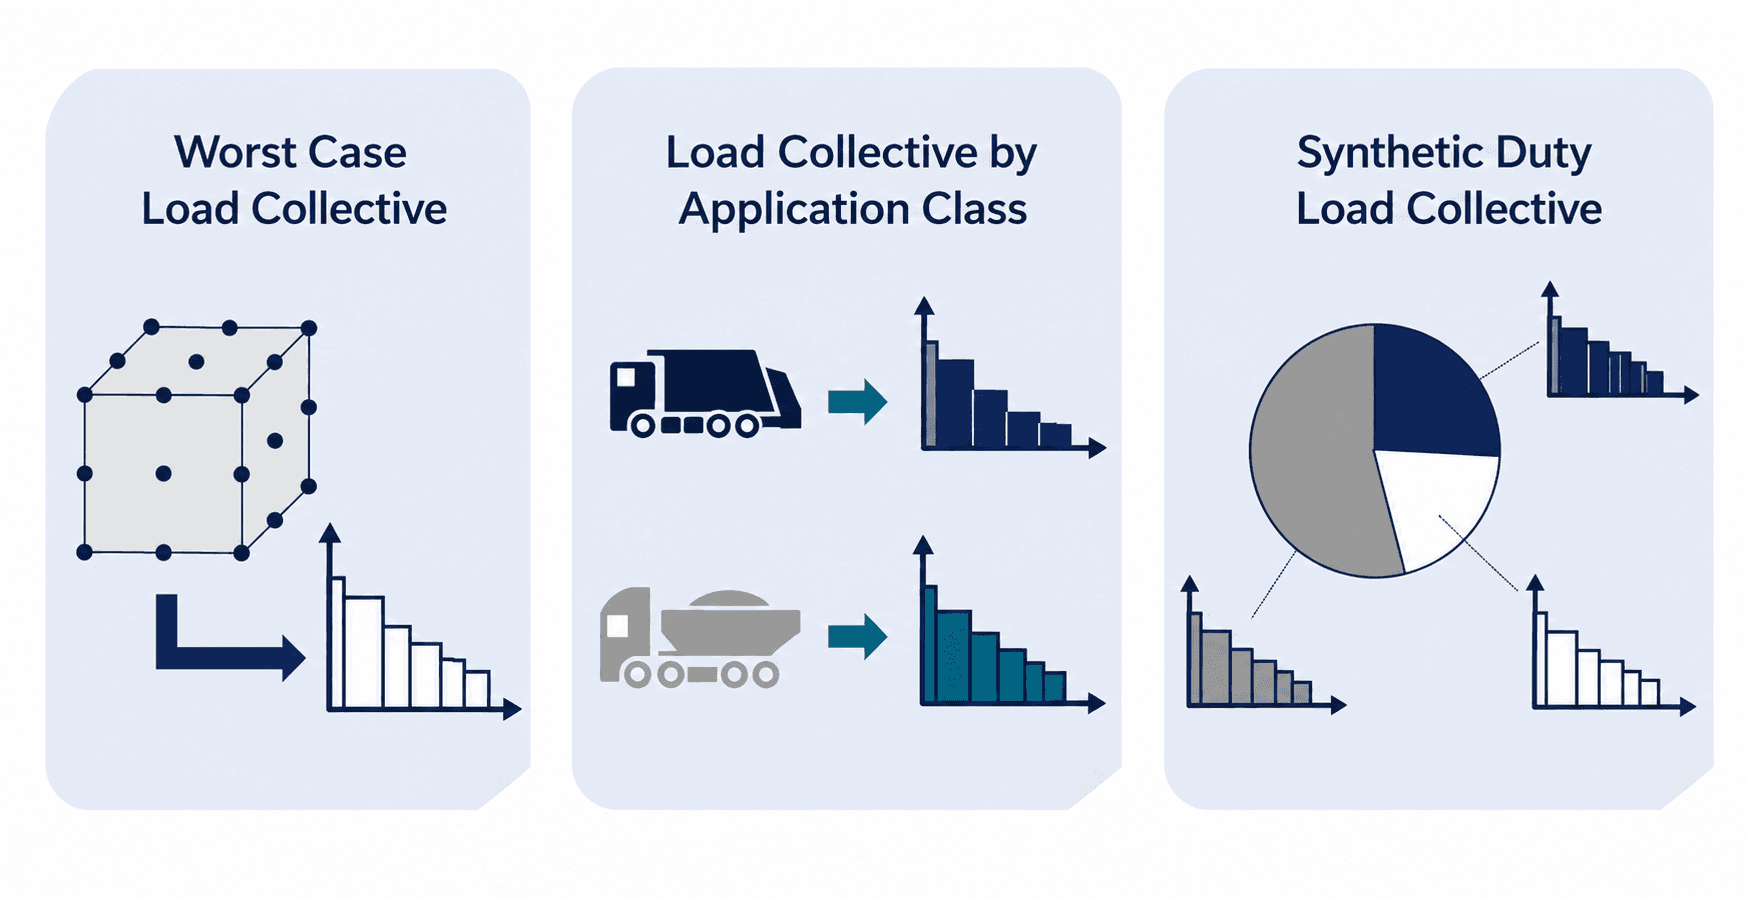
04 / Verification and release
Calculations, models, test results and field data are combined in a traceable verification case, supporting a robust assessment and documented release decision.
Explore topic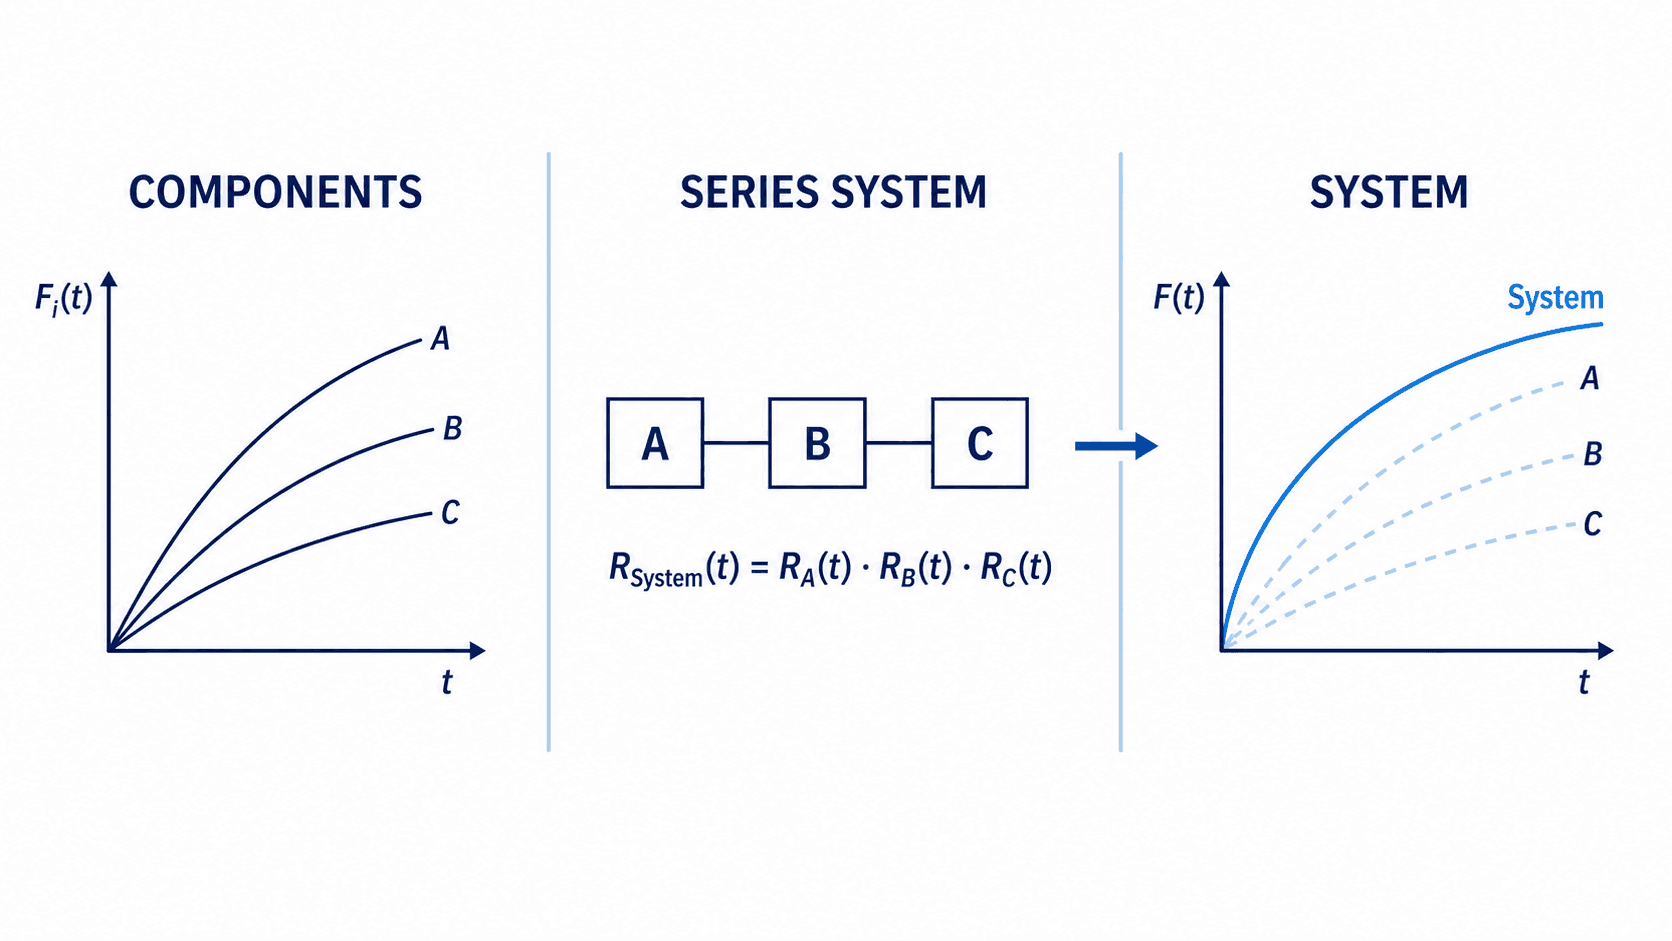
05 / Data and prediction
Test and field data are analysed statistically and translated into lifetime models. Predictions quantify failure behaviour, remaining life and uncertainty for technical decisions.
Explore topic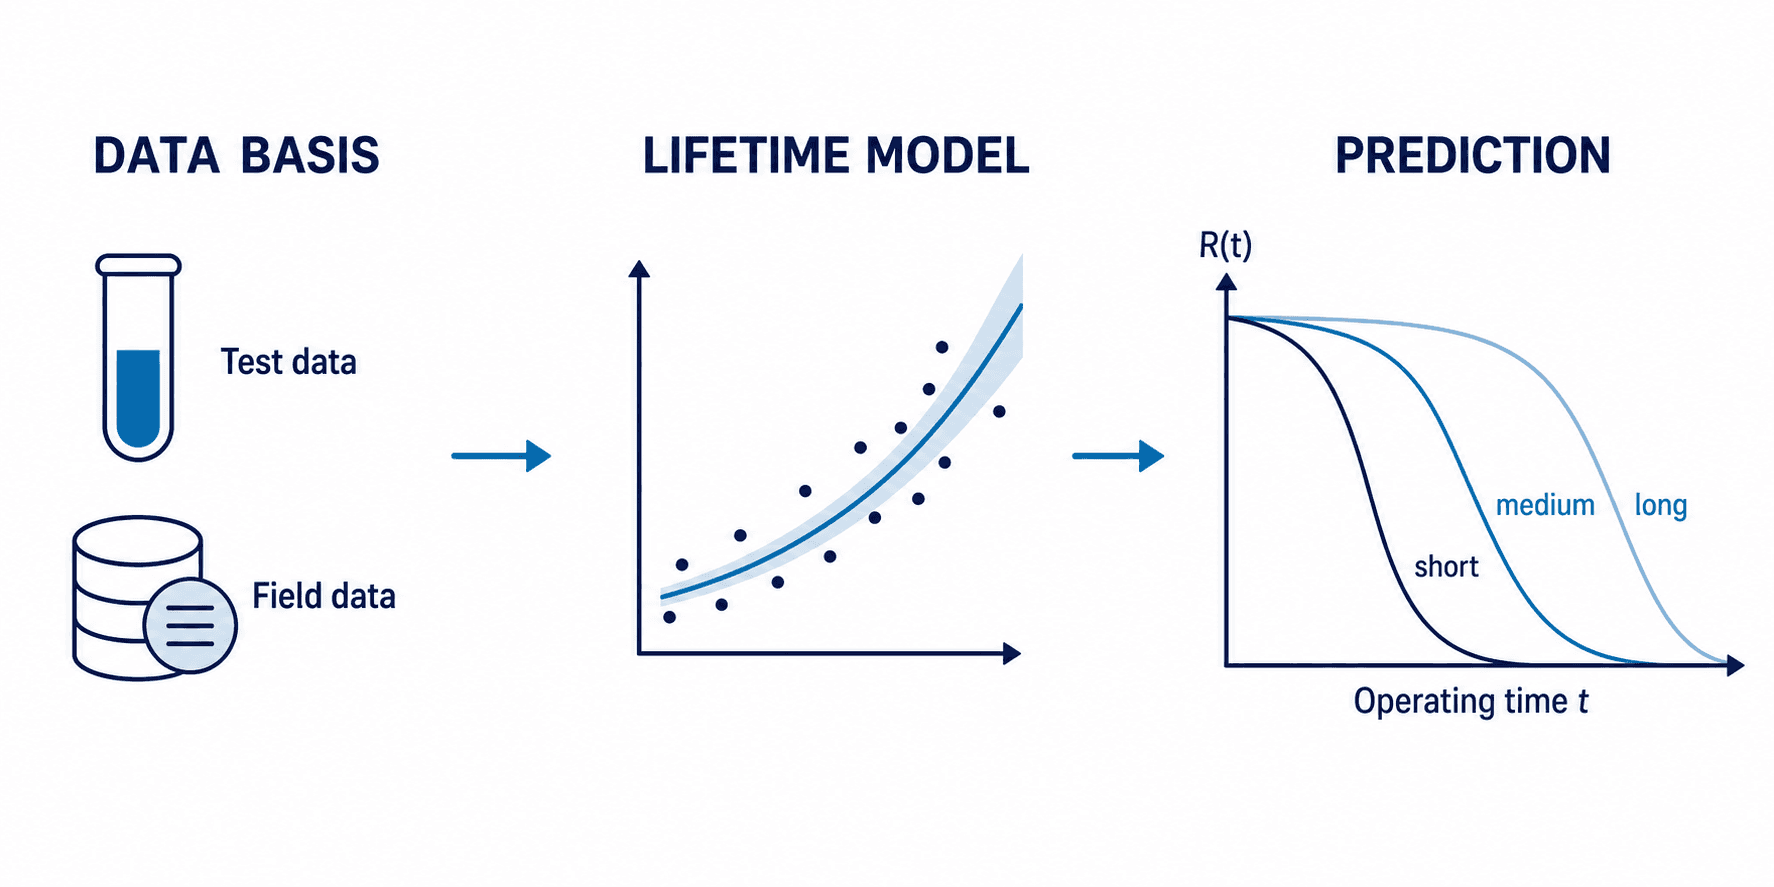
Separate methodological focus
DoE is not a sixth sub-process. Statistical experimental design complements testing and data analysis when multiple factors, interactions and robust settings need to be understood with as few experimental runs as practical.
Explore the DoE fundamentals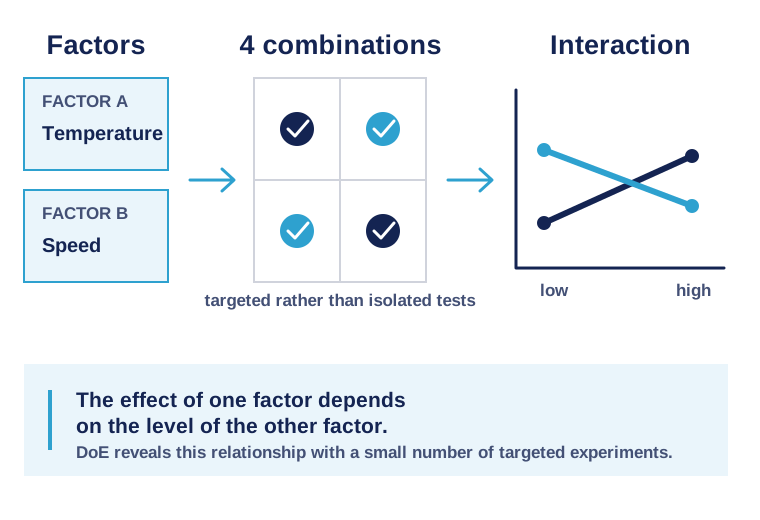
In an initial discussion, we identify the relevant sub-process and the right methodological depth for your decision.